What is ColorPalette Pro?
The ColorPalette Pro is an advanced image analysis tool that extracts dominant and harmonious color palettes from any uploaded image using sophisticated computer vision algorithms. This powerful utility analyzes image pixel data to identify primary colors, calculate color frequencies, and generate comprehensive color schemes that can be exported for design projects.
Unlike basic color extraction tools, our platform offers three distinct color extraction algorithms: K-Means clustering for precision, Vibrant extraction for colorful palettes, and Median Cut for balanced results. Each algorithm provides unique insights into your image's color composition, allowing you to choose the best approach for your specific needs.
This professional-grade tool is designed for graphic designers, web developers, UI/UX designers, photographers, artists, and creative professionals who need to extract color inspiration from visual content. Whether you're building brand guidelines from product photos, creating website themes from landscape images, or developing color schemes from artwork, ColorPalette Pro provides the scientific analysis and practical export tools you need.
With its real-time color analysis, multiple algorithm options, comprehensive export formats, and suggested color schemes, ColorPalette Pro transforms complex color extraction into an accessible, efficient workflow that bridges the gap between visual inspiration and practical color implementation.
How to Use ColorPalette Pro
1
Upload Your Image
Drag and drop or select an image file (JPG, PNG, GIF, or WEBP) up to 10MB. The tool supports all common image formats and immediately displays a preview of your uploaded image while beginning the color analysis process.
2
Choose Extraction Algorithm
Select from three color extraction algorithms: K-Means (precise color clustering), Vibrant (colorful palette emphasis), or Median Cut (balanced color distribution). Each algorithm produces different results based on its mathematical approach to color analysis.
3
Adjust Color Parameters
Control how many colors to extract (1-20) using the color count slider. The tool displays real-time progress as it analyzes your image, showing the percentage of extraction completion and dominant color identification.
4
Analyze and Export Results
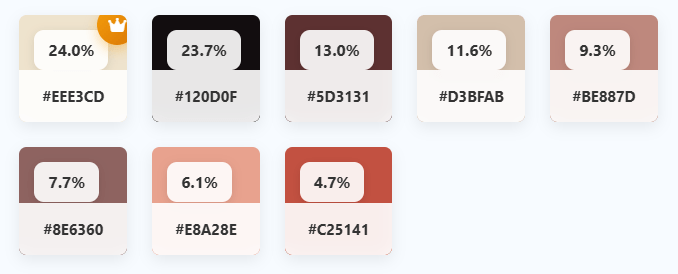
Examine the extracted color palette showing each color's percentage in the image, view detailed color analysis, explore suggested harmonious color schemes, and export results as JSON or PNG files for use in your projects.
Key Features
Three Extraction Algorithms: Choose between K-Means, Vibrant, and Median Cut algorithms for different color analysis approaches and results.
Dominant Color Identification: Automatically identifies and marks the most dominant color in your image with percentage calculations.
Comprehensive Color Analysis: Provides detailed breakdown including color percentages, RGB/HSL/CMYK values, and descriptive color names.
Suggested Color Schemes: Generates harmonious color schemes based on extracted colors using complementary and analogous color theory.
Multiple Export Formats: Export color palettes as JSON files for development or PNG images for design applications.
Real-time Progress Tracking: Visual progress bar shows color extraction status and percentage completion during processing.
Color Extraction Algorithms Explained
K-Means Algorithm
Uses statistical clustering to group similar colors, producing precise, mathematically accurate color palettes ideal for technical applications and design systems.
Vibrant Algorithm
Prioritizes saturated and vivid colors, emphasizing colorful elements in images to create dynamic, eye-catching palettes perfect for bold designs.
Median Cut Algorithm
Divides color space into equal regions for balanced color distribution, creating harmonious palettes that represent the overall image color composition.
Pro Tips for Effective Color Extraction
- For photographs with complex color ranges, use K-Means algorithm with 8-12 colors for comprehensive analysis
- When extracting colors from logos or graphic designs, try the Vibrant algorithm to emphasize primary brand colors
- For landscape or nature photos, Median Cut often produces the most harmonious and natural-looking palettes
- Use color percentage data to understand which colors dominate your composition and balance your designs accordingly
- Export JSON files for development workflows and CSS variable generation from extracted colors
- Create PNG palette images for easy reference in design software like Photoshop, Figma, or Sketch
- Combine extracted palette with suggested color schemes to create complete color systems for your projects
- For brand color extraction, upload product photos or marketing materials to capture authentic brand colors
- Test different color count settings to find the optimal balance between detail and simplicity for your needs
- Always verify extracted colors in your target application to ensure they work well in context
Frequently Asked Questions
How does the tool extract colors from images?
+
The tool uses computer vision algorithms to analyze image pixel data: Pixel sampling - analyzes thousands of pixels from your uploaded image; Color clustering - groups similar colors together using mathematical algorithms; Frequency analysis - calculates how often each color appears in the image; Algorithm processing - applies K-Means, Vibrant, or Median Cut algorithms depending on your selection. The process involves: Image loading - converts image to canvas for pixel access; Data extraction - reads RGB values from each sampled pixel; Algorithm application - processes pixel data using selected algorithm; Result generation - produces color palette with percentages and analysis. All processing happens locally in your browser - no image data is sent to servers.
What's the difference between the three extraction algorithms?
+
K-Means algorithm uses statistical clustering to group similar colors. Best for: Precise color analysis; Technical applications requiring accurate color representation; Design systems where exact colors matter. Vibrant algorithm prioritizes saturated, colorful pixels. Best for: Bold, eye-catching palettes; Marketing materials needing vibrant colors; Images with colorful elements you want to emphasize. Median Cut algorithm divides color space evenly for balanced representation. Best for: Natural-looking palettes; Overall color composition analysis; Harmonious color schemes from complex images. Each algorithm has different mathematical approaches, making them suitable for different types of images and design goals.
What image formats and sizes are supported?
+
The tool supports common image formats and reasonable file sizes: Supported formats - JPG, PNG, GIF, WEBP; Maximum file size - 10MB; Recommended dimensions - up to 4000×4000 pixels; Color spaces - sRGB (standard web colors). For optimal performance: Compress large images before upload for faster processing; Use standard web formats like JPG or PNG; Avoid extremely high resolution images (the tool samples pixels, so ultra-high resolution doesn't improve results); Check image quality - low-quality or heavily compressed images may produce less accurate results. The tool processes images locally, so very large files may take longer to analyze depending on your device's capabilities.
How accurate are the color percentages shown?
+
The color percentages are mathematically calculated based on pixel sampling: Sampling method - tool analyzes representative pixel samples from your image; Algorithm accuracy - percentages reflect the proportion of sampled pixels matching each color cluster; Statistical representation - percentages show relative color dominance in the image; Visual verification - you can compare percentages with visual appearance of your image. Important considerations: Sampling limitations - very large images use sampling for performance; Color similarity thresholds - similar colors may be grouped together; Algorithm differences - different algorithms may produce slightly different percentages. For most practical purposes, the percentages provide accurate relative measurements of color dominance in your images.
Can I use extracted colors for commercial projects?
+
Color extraction results can generally be used in commercial projects, but consider: Image copyright - you must have rights to use the source image; Color copyright - individual colors cannot be copyrighted, but color combinations in specific contexts may be trademarked; Practical considerations - extracted colors are mathematical representations of image data. Best practices: Use your own images or properly licensed stock photos; Verify color combinations don't infringe on existing trademarks; Modify extracted colors slightly to create unique palettes; Document your process if using for client work. The tool provides color data - how you use that data in your projects is your responsibility. For sensitive commercial applications, consult with legal professionals about specific color usage.
How are suggested color schemes generated?
+
Suggested color schemes are generated using color theory principles applied to extracted colors: Dominant color selection - uses the most frequent color from your image; Complementary colors - calculates colors opposite on the color wheel from dominant color; Analogous colors - selects colors adjacent to dominant color on the color wheel; Triadic colors - creates balanced three-color combinations; Mathematical transformations - applies hue rotations in HSL color space. The process: Convert to HSL - transforms RGB colors to Hue, Saturation, Lightness format; Apply color theory - calculates harmonious color relationships; Convert back to RGB/HEX - produces usable color values; Visual presentation - displays colors in harmonious arrangement. These suggestions provide starting points for creating complete color systems based on your image colors.
What's the difference between JSON and PNG exports?
+
JSON export and PNG export serve different purposes in the design workflow: JSON export - contains structured color data including HEX codes, RGB values, percentages, and metadata; ideal for: Development workflows - import into code projects; CSS variable generation - create design tokens; Data processing - further analysis or manipulation; Documentation - structured color system records. PNG export - creates visual color palette image showing colors with HEX codes; ideal for: Design software - import into Photoshop, Figma, Sketch; Visual reference - presentations or style guides; Quick sharing - social media or team communication; Print materials - physical color references. Choose JSON for technical implementation, PNG for visual design work.
How many colors should I extract from an image?
+
The optimal color count depends on your image and purpose: Simple images (logos, graphics) - 3-6 colors often sufficient; Photographs - 8-12 colors capture complexity without overwhelming; Detailed artwork - 12-16 colors for comprehensive analysis; Design systems - 5-8 core colors plus variations. Considerations: Visual clarity - too many colors can be overwhelming; Practical use - most designs use 3-7 primary colors; Algorithm performance - more colors require more processing; Image complexity - detailed images benefit from more colors. Start with 8 colors as a balanced default, then adjust based on: Color repetition - if many colors are similar, reduce count; Missing colors - if important colors are missing, increase count; Design needs - match color count to your project requirements.
Can I process multiple images to create combined color palettes?
+
While the tool processes one image at a time, you can create combined palettes by: Exporting multiple JSON files - process each image separately and export JSON results; Combining data manually - merge color data from multiple JSON exports; Creating composite images - combine multiple source images into one before upload; Using design software - import multiple PNG palettes into design tools. For brand color systems from multiple images: Process key brand images - logo, products, marketing materials; Extract colors from each - note percentages and relationships; Identify common colors - look for colors appearing across multiple images; Create unified palette - combine and refine colors into cohesive system. The tool provides foundation data - creative combination is part of the design process.
Is my image data secure when using this tool?
+
Yes, your image data is completely secure with these privacy features: Local processing - all color extraction happens in your browser using JavaScript; No server transmission - images never leave your computer; No data storage - we don't store, analyze, or have access to your images; Privacy by design - ideal for confidential or proprietary images; Offline capability - once loaded, works without internet connection. This approach ensures: Maximum privacy - your intellectual property remains secure; Fast processing - no network latency or upload delays; No data exposure - perfect for sensitive projects; Complete control - you can save the page locally for permanent offline use. Your image processing remains entirely between you and your device - we never see your images or extracted colors.